Figure 1 A time history plot of the maximum principle stresses. The horizontal grey line is from 1.5 A ( 1.19 GPa)
and the grey vertical line intercepts the time axis at tbrittle.
In this assignment, the Kalthoff problem was examined
by apply a finite element model based on the Johnson-Cook relation. The
material modeled was 4340 steel. Table 1 lists the material properties
and material constants for the Johnson-Cook model for 4340 steel.
| Material | A
(MPa) |
B
(MPa) |
C | n | m | density
(kg/m3) |
m
(degrees C) |
K
(GPa) |
µ
(GPa) |
c
(J/kg C) |
| 4340 Steel | 792.19 | 509.51 | 0.014 | 0.26 | 0.55 | 7,840 | 1,520 | 157 | 76 | 477 |
Once the finite element model mesh created with the proper constants, the mesh was submitted to a program called Dyna2D for evaluation. With the output from Dyna2D, a visualization package called Orion was used to interpret these results. Orion created a plot of the time history of the maximum principal stresses and a plot of the time history of the Von-Moses stress. The smallest value of time in the time history plot of the maximum principal stresses, for any of the elements examined, where the maximum prinicpal stress is equal to 1.5 A is called tbrittle. An example of how this "measurement" is given in Figure 1.
Figure 1 A time history plot of the maximum principle stresses.
The horizontal grey line is from 1.5 A ( 1.19 GPa)
and the grey vertical line intercepts the time axis at tbrittle.
The smallest value of time in the time history plot
of the Von Mises stress, for any of the elements examined, where the Von
Mises stress has dropped to 90% of its maximum value is called tductile.
All of the times and the specific mesh elements which failed are listed
in Table 2.
| Brittle Behavior | Ductile Behavior | |||
| Vo (m/s) | tbrittle (s) | Number of Failed Mesh Element | tductile (s) | Number of Failed Mesh Element |
| 10 | 11 | 43,49,55 | 23 | 112 |
| 20 | 10 | 55 | 16 | 112 |
| 30 | 10 | 43,49,55,78 | 14 | 112 |
| 40 | 10 | 43,49,55,78 | 14 | 112, 162 |
| 50 | 10 | 43,49,55,78 | 13 | 180,174,168,162 |
| 60 | 11 | 43,49,55,78 | 13 | 109 |
Table 2 A table of results from the Johnson-Cook finite element
model for the Kalthoff problem.
The values for tductile and tbrittle are plotted versus the impact velocity, Vo, in Figure 2. Please note that the two curves do not intersect. Therefore, no critical time, tcritical, can be found.
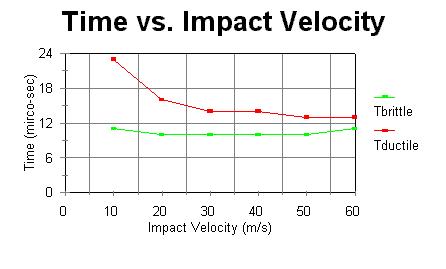
Figure 2 A graph of the time to failure versus impact velocity.
From the number of simulations run, no tcritical could be found. But if the graph is examined, the slope of tbrittle seems to be increasing and the slope of tductile seems to be leveling off or decreasing. Therefore, I would suggest to run several more simulations with the impact velocity greater than 60 m/s. Then one should be able to find a tcritical.